Localization script
This scripts allows to retrieve the location of RR03. It returns the most probable drift from the deployment location. The Inputs and Parameter parts can be modified to fulfill the user needs.
import numpy as np
import pandas as pd
import xarray as xr
import obsea
from obspy.clients.fdsn import Client
from dask import delayed, compute
from dask.diagnostics import ProgressBar
import colorcet as cc
import matplotlib.pyplot as plt
# Inputs
client = Client('RESIF')
inventory = client.get_stations(network='YV', station='RR03', level='response')
network, = inventory
ais_fname = obsea.get_dataset_path('ais_marine_traffic')
mmsi_list = pd.read_csv(
obsea.get_dataset_path('mmsi_list'), squeeze=True).tolist()
ship_length = pd.read_csv(
obsea.get_dataset_path('ship_length'), index_col='mmsi')
# Paremeters
timedelta = pd.Timedelta(24, 'h')
radius = 30_000 # meters
cpa = 15_000 # meters
tf_nperseg = 1024
tf_step = 128
tf_water_level = None
ndecimate = 4
nresample = 4
celerity = 1502.0 # meters per seconds
depth = 4340.0 # meters
xp = np.linspace(-700 - 125, 700 - 125, 141) # meters
yp = np.linspace(-700 + 450, 700 + 450, 141) # meters
nbootstrap = 10000
blur_sigma = 100 # meters
print('-------------------\nLOCALIZATION SCRIPT\n-------------------')
# Process AIS
print('Process AIS.')
ais = obsea.read_marine_traffic(ais_fname)
ais = obsea.select_ships(ais, mmsi_list)
global_tracks = obsea.read_ais(ais, timedelta)
local_tracks = {}
for station in network:
tracks = obsea.select_tracks(
global_tracks, station, radius, cpa)
if tracks is not None:
local_tracks.update({station.code: tracks})
else:
pass
# Process data
@delayed
def process(mmsi, track, station):
st = obsea.load_stream(
track, client, inventory, station, 'BDH', nb_channels=1)
if st is None:
return None
tf = obsea.time_frequency(st, tf_nperseg, tf_step, tf_water_level)
tq = obsea.cepstrogram(tf['p'])
tq = obsea.svd_filter(tq)
tq = obsea.decimate(tq, 'time', ndecimate)
tq = obsea.highpass(tq, 'quefrency')
tq = obsea.resample(tq, 'quefrency', nresample)
tq = obsea.analytic_signal(tq)
B = 0.2*ship_length.loc[mmsi].values
track = obsea.correct_track(track, B)
track = track.interp_like(tq)
delay = obsea.make_delay(track)
beamform = obsea.make_beamform(xp, yp, tq, delay)
img = beamform(celerity, depth)
return img
print('Process Data.')
results = [process(mmsi, track, station) for mmsi, track in tracks.items()]
with ProgressBar():
results = compute(*results)
results = [result for result in results if result is not None]
result = xr.concat(results, dim='route').rename(station.code)
# Performance estimation
@delayed
def process(result, n_sample):
index = np.random.choice(result.coords['route'].size, n_sample)
sample = result.isel(route=index)
result = sample.mean('route')
return result == result.max()
print('Estimate Uncertainties.')
n = 10000
with ProgressBar():
nresult, = compute(process(result, len(results)) for i in range(n))
image = result.mean('route')
image.values = np.sum([r.values for r in nresult], axis=0)
print('Plot results.')
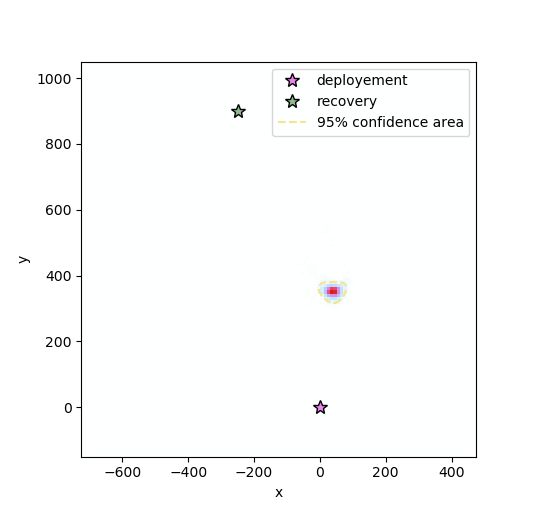
fig, ax = plt.subplots(figsize=(12, 12))
(image**(1 / np.sqrt(2))).plot.imshow(cmap=cc.cm.linear_wcmr_100_45_c42,
add_colorbar=False, ax=ax)
image.plot.contour(add_colorbar=False, levels=[19],
colors='khaki', linewidths=1.5, linestyles='--', ax=ax)
ax.plot([0], [0], '*', ms=10, mfc='violet', mec='black', label='deployement')
ax.plot([-250], [900], '*', ms=10, mfc='darkseagreen',
mec='black', label='recovery')
ax.plot([], [], color='khaki', linewidth=1.5,
linestyle='--', label='95% confidence area')
ax.axis('square')
ax.set_xlim([-600 - 125, 600 - 125])
ax.set_ylim([-600 + 450, 600 + 450])
ax.legend()
plt.show()
print()
Output:
------------------
LOCALIZATION SCRIPT
------------------
Process AIS.
Process Data.
[########################################] | 100% Completed |  1min 21.4s
Estimate Uncertainties.
[########################################] | 100% Completed | 21.8s
Plot results.